Resting State vs. Stressed State: What Brain Wave Data Tells Us (Mar 2023)
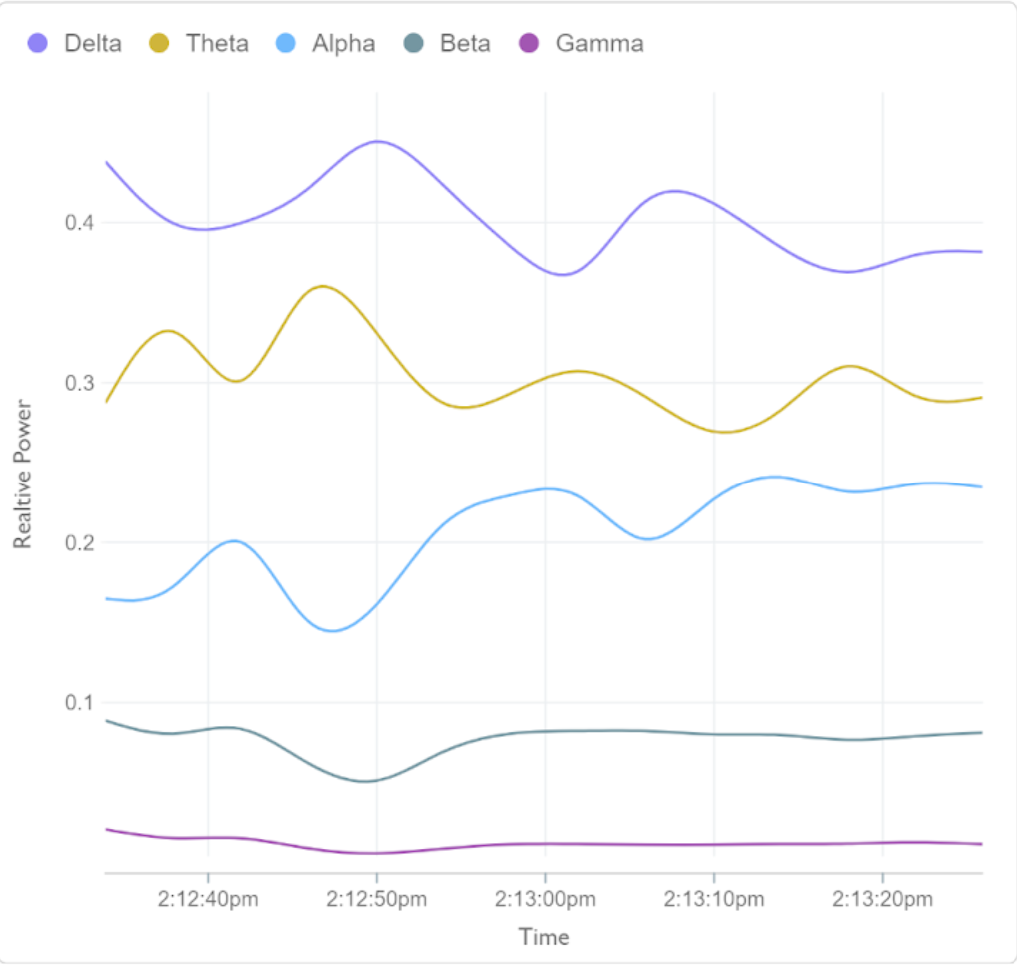
I conducted an experiment with the Crown device to illustrate the impact of stress. Chart 1 displayed below is a snapshot of my brain wave data recorded for a minute when I returned from a stressful school day versus Chart 2, which shows my brain in a relaxed state of mind.
Chart 1
Chart 2
The main takeaway from these two data charts is how the brain wave types appear in different states of mind. The beta waves (in teal color) are more pronounced when the brain is experiencing irritation, anxiety, or discomfort, and are almost flat during a relaxed state. In the stressed state, it clearly shows greater displacement.
More broadly, the choppiness of the brain wave data in the stressful state, even in a short period of time, allows us to measure a state of stress. It is possible by undertaking repeated experiments to create a model which can predict degrees of stress just by observing the brain wave data.


